Thank you for visiting nature.com. You are using a browser version with limited support for CSS. To obtain
the best experience, we recommend you use a more up to date browser (or turn off compatibility mode in
Internet Explorer). In the meantime, to ensure continued support, we are displaying the site without styles
and JavaScript.
Staff at a car-manufacturing plant in Wuhan, China, observe social-distancing measures during their lunch break. Credit: AFP/Getty
When Neil Ferguson visited the heart of British government in London’s Downing Street, he was much closer to the COVID-19 pandemic than he realized. Ferguson, a mathematical epidemiologist at Imperial College London, briefed officials in mid-March on the latest results of his team’s computer models, which simulated the rapid spread of the coronavirus SARS-CoV-2 through the UK population. Less than 36 hours later, he announced on Twitter that he had a fever and a cough. A positive test followed. The disease-tracking scientist had become a data point in his own project.
Ferguson is one of the highest-profile faces in the effort to use mathematical models that predict the spread of the virus — and that show how government actions could alter the course of the outbreak. “It’s been an immensely intensive and exhausting few months,” says Ferguson, who kept working throughout his relatively mild symptoms of COVID-19. “I haven’t really had a day off since mid-January.”
Research does not get much more policy-relevant than this. When updated data in the Imperial team’s model1 indicated that the United Kingdom’s health service would soon be overwhelmed with severe cases of COVID-19, and might face more than 500,000 deaths if the government took no action, Prime Minister Boris Johnson almost immediately announced stringent new restrictions on people’s movements. The same model suggested that, with no action, the United States might face 2.2 million deaths; it was shared with the White House and new guidance on social distancing quickly followed (see ‘Simulation shock’).
Source: Ref. 1
Governments across the world are relying on mathematical projections to help guide decisions in this pandemic. Computer simulations account for only a fraction of the data analyses that modelling teams have performed in the crisis, Ferguson notes, but they are an increasingly important part of policymaking. But, as he and other modellers warn, much information about how SARS-CoV-2 spreads is still unknown and must be estimated or assumed — and that limits the precision of forecasts. An earlier version of the Imperial model, for instance, estimated that SARS-CoV-2 would be about as severe as influenza in necessitating the hospitalization of those infected. That turned out to be incorrect.
The true performance of simulations in this pandemic might become clear only months or years from now. But to understand the value of COVID-19 models, it’s crucial to know how they are made and the assumptions on which they are built. “We’re building simplified representations of reality. Models are not crystal balls,” Ferguson says.
Coronavirus models: the basics
Many of the models simulating how diseases spread are unique to individual academic groups that have been developing them for years. But the mathematical principles are similar. They are based around trying to understand how people move between three main states, and how quickly: individuals are either susceptible (S) to the virus; have become infected (I); and then either recover (R) or die. The R group is presumed to be immune to the virus, so can no longer pass on the infection. People with natural immunity would also belong to this group.
The simplest SIR models make basic assumptions, such as that everyone has the same chance of catching the virus from an infected person because the population is perfectly and evenly mixed, and that people with the disease are all equally infectious until they die or recover. More-advanced models, which make the quantitative predictions policymakers need during an emerging pandemic, subdivide people into smaller groups — by age, sex, health status, employment, number of contacts, and so on — to set who meets whom, when and in which places (see ‘Measuring social mixing’).
Using detailed information on population size and density, how old people are, transport links, the size of social networks and health-care provision, modellers build a virtual copy of a city, region or an entire country using differential equations to govern the movements and interactions of population groups in space and time. Then they seed this world with an infection and watch how things unfold.
But that, in turn, requires information that can be only loosely estimated at the start of an epidemic, such as the proportion of infected people who die, and the basic reproduction number (R0) — the number of people, on average, to whom one infected person will pass the virus. The modellers at Imperial, for instance, estimated in their 16 March report1 that 0.9% of people infected with COVID-19 would die (a figure adjusted to the United Kingdom’s specific demographics); that the R0 was between 2 and 2.6; and that SARS-CoV-2 takes 5.1 days to incubate in an infected person. They also assumed that people who don’t show symptoms can still spread the virus 4.6 days after infection; that others can spread the virus from 12 hours before they develop signs of disease; and that the latter group is 50% more infectious than the former. Those figures depended on other kinds of modelling: rough estimates by epidemiologists who tried to piece together the virus’s basic properties from incomplete information in different countries during the pandemic’s early stages.
Some parameters, meanwhile, must be entirely assumed. The Imperial team had to surmise, for instance, that there is no natural immunity to COVID-19 — so the entire population starts out in the susceptible group — and that people who recover from COVID-19 are immune to reinfection in the short term.
A simulation run using these parameters would always give the same forecast. But simulations known as stochastic models inject a little randomness — like rolling a virtual dice to see whether or not someone in the I group infects an S person when they meet, for instance. This gives a range of likely possibilities when the model is run multiple times.
Modellers also simulate people’s activities in different ways. In ‘equation-based’ models, individuals are sorted into population groups. But as the groups are broken into smaller, more-representative social subsets to better reflect reality, the models get increasingly complicated. An alternative approach is to use an ‘agent-based’ method in which each individual moves around and acts according to their own specific rules — rather like the simulated characters in the video-game series The Sims.
“You have a couple of lines of code, and those drive how your agents act, how they go about their day,” says Elizabeth Hunter, who works on models of disease transmission at Technological University Dublin.
Agent-based models build the same kinds of virtual world as the equation-based ones, but each person can behave differently on a given day or in an identical situation. “These very specific models are extremely data hungry,” says Kathleen O’Reilly, an epidemiologist at the London School of Hygiene and Tropical Medicine (LSHTM). “You need to collect information on households, how individuals travel to work and what they do at the weekend.” For example, researchers at the LSHTM, University College London and the University of Cambridge, UK, collected social-contact data from more than 36,000 volunteers in a citizen-science project run through the BBC, the UK national broadcaster. Some modellers aiding the UK government used this data set, which was reported in a February preprint2.
Which model to choose?
The Imperial team has used both agent-based and equation-based models in this pandemic. The 16 March simulations that the team ran to inform the UK government’s COVID-19 response used an agent-based model built in 2005 to see what would happen in Thailand if H5N1 avian flu mutated to a version that could spread easily between people3. (In 2006, the same model was used to study how the United Kingdom and the United States might mitigate the impact of a lethal flu pandemic4.) Ferguson told Nature in 2005 that collecting detailed data on Thailand’s population was harder than writing the programming code for the model. That code was not released when his team’s projections on the coronavirus pandemic were first made public, but the team is working with Microsoft to tidy up the code and make it available, Ferguson says.
UK epidemiologist Neil Ferguson.Credit: Imperial College London
On 26 March, Ferguson and his team released global projections of the impact of COVID-19 that uses the simpler equation-based approach5. It divides people into four groups: S, E, I and R, where ‘E’ refers to those who have been exposed, but who are not yet infectious. “They give broadly similar overall numbers,” says epidemiologist Azra Ghani, who is also in the Imperial group. For instance, the global projections suggest that, had the United States taken no action against the virus, it would have seen 2.18 million deaths. By comparison, the earlier agent-based simulation, run using the same assumptions about mortality rate and reproduction number, estimated 2.2 million US deaths1.
The different kinds of model have their own strengths and weaknesses, says Vittoria Colizza, a modeller at the Pierre Louis Institute of Epidemiology and Public Health in Paris, who is advising the French government during the current emergency. “It depends on the question you want to ask,” she says.
One difference comes down to the number of people that modellers expect to act in the same way. Being able to bunch one group into a compartment inside an equation-based model makes things simpler — and quicker — because the model doesn’t need to run at the high-resolution level of treating everyone as an individual. When Colizza and her team wanted to test the effects on infection rates of compelling large parts of the French population to work from home, for example, she used an equation-based model. “We didn’t need to track each individual separately and see if they were spending some time at work or some time at school,” she says.
Although projections might not diverge wildly depending on the approach chosen, it’s natural to wonder how reliable any of the simulations are. Unfortunately, during a pandemic it is hard to get data — such as on infection rates — against which to judge a model’s projections.
A patient at a hospital in Cremona, Italy.Credit: Marco Mantovani/Getty
“You can project forwards and then compare against what you get. But the problem is that our surveillance systems are pretty rubbish,” says John Edmunds, who is a modeller at the LSHTM. “The total numbers of cases reported, is that accurate? No. Accurate anywhere? No.”
“Forecasts made during an outbreak are rarely investigated during or after the event for their accuracy, and only recently have forecasters begun to make results, code, models and data available for retrospective analysis,” Edmunds and his team noted last year in a paper6 that assessed the performance of forecasts made in a 2014–15 Ebola outbreak in Sierra Leone. They found that it was possible to reliably predict the epidemic’s course one or two weeks ahead of time, but no longer, because of the inherent uncertainty and lack of knowledge about the outbreak.
To minimize the impact of incomplete data and incorrect assumptions, modellers typically carry out hundreds of separate runs, with the input parameters tweaked slightly each time. This ‘sensitivity analysis’ tries to prevent model outputs swinging wildly when a single input changes. And to avoid too much reliance on one model, Ferguson says, the UK government took advice from a number of modelling groups, including teams at Imperial and the LSHTM (see, for example, ref. 7). “We all reached similar conclusions,” he says.
Updating the simulation
Media reports have suggested that an update to the Imperial team’s model in early March was a critical factor in jolting the UK government into changing its policy on the pandemic. The researchers initially estimated that 15% of hospital cases would need to be treated in an intensive-care unit (ICU), but then updated that to 30%, a figure used in the first public release of their work on 16 March. That model showed the UK health service, with just over 4,000 ICU beds, would be overwhelmed.
The ExCel conference centre in London has been transformed into a temporary hospital.Credit: Stefan Rousseau/WPA Pool/Getty
Government officials had previously talked up a theory of allowing the disease to spread while protecting the oldest in society, because large numbers of infected people would recover and provide herd immunity for the rest. But they changed their course on seeing the new figures, ordering social-distancing measures. Critics then asked why social distancing hadn’t been discussed earlier, why widespread testing hadn’t happened, and why modellers had even chosen the 15% figure, given that a January paper showed that more than 30% of a small group of people with COVID-19 in China needed treatment in ICUs8.
Ferguson says the significance of the model update might have been exaggerated. Even before that, he says, models already indicated that COVID-19, if left entirely unmitigated, could kill in the order of half a million UK citizens over the next year and that ICUs would be stretched beyond capacity. Advisory teams had discussed suppressing the pandemic by social distancing, but officials were worried that this would only lead to a bigger second outbreak later in the year. Widespread testing of the kind seen in South Korea was not considered; but, in part, says Ferguson, this was because Britain’s health agency had told government advisers that it would not be able to scale up testing fast enough.
Enjoying our latest content?
Login or create an account to continue
Access the most recent journalism from Nature's award-winning team
Explore the latest features & opinion covering groundbreaking research


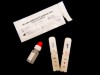
 Coronavirus tests: researchers chase new diagnostics to fight the pandemic
 ‘We need to be alert’: Scientists fear second coronavirus wave as China’s lockdowns ease
 Latest news on the coronavirus outbreak
 Coronavirus and COVID-19: Keep up to date