
A common way to measure inequality is by comparing differences in income between people or countries. However, this approach may overlook a more important dimension of human well-being: how we spend our time. Using data from the World Bank, this article shows that time inequality has dramatically declined over the past six decades.
The Canadian psychologist Jordan Peterson notes that you should “compare yourself to who you were yesterday, not who someone else is today.” Since we all get exactly 24 hours a day, and no one can really buy time (otherwise, rich people would never die), it might also be better to compare differences in how we spend our time. Instead of comparing differences in money income between people, we should compare differences in how we spend our time today versus yesterday.
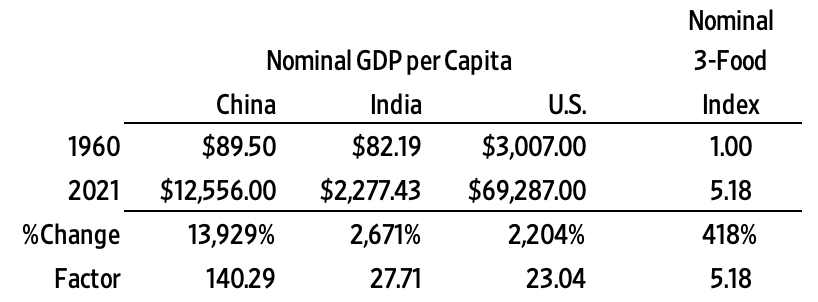
According to the World Bank, in 1960, nominal gross domestic product (GDP) per capita in China was $89.50. By 2021, it had increased by 13,929 percent to $12,556. Over the same period, nominal GDP in India increased by 2,671 percent from $82.19 to $2,277.43, and in the United States, it increased from $3,007 to $69,287, or by 2,204 percent.
Chinese GDP per capita grew six times faster than the U.S. GDP per capita. The ratio of China to U.S. GDP per capita in 1960 was 33.6. By 2021, it had fallen to 5.52. The ratio of India to U.S. GDP per capita in 1960 was 36.6. By 2021, it had fallen to 30.4. China is making pretty good progress, but there is still a significant gap in GDP per capita.
Perhaps a better way to compare inequality is with time. Let’s start with the time to earn the money to buy a basket of basic food. The World Bank tracks the nominal price of rice, wheat, and maize (corn). These three commodities represent the most common sources of calories around the planet. An index of the nominal prices indicates an increase of 418 percent from a base value of 1 in 1960 to 5.18 in 2021.
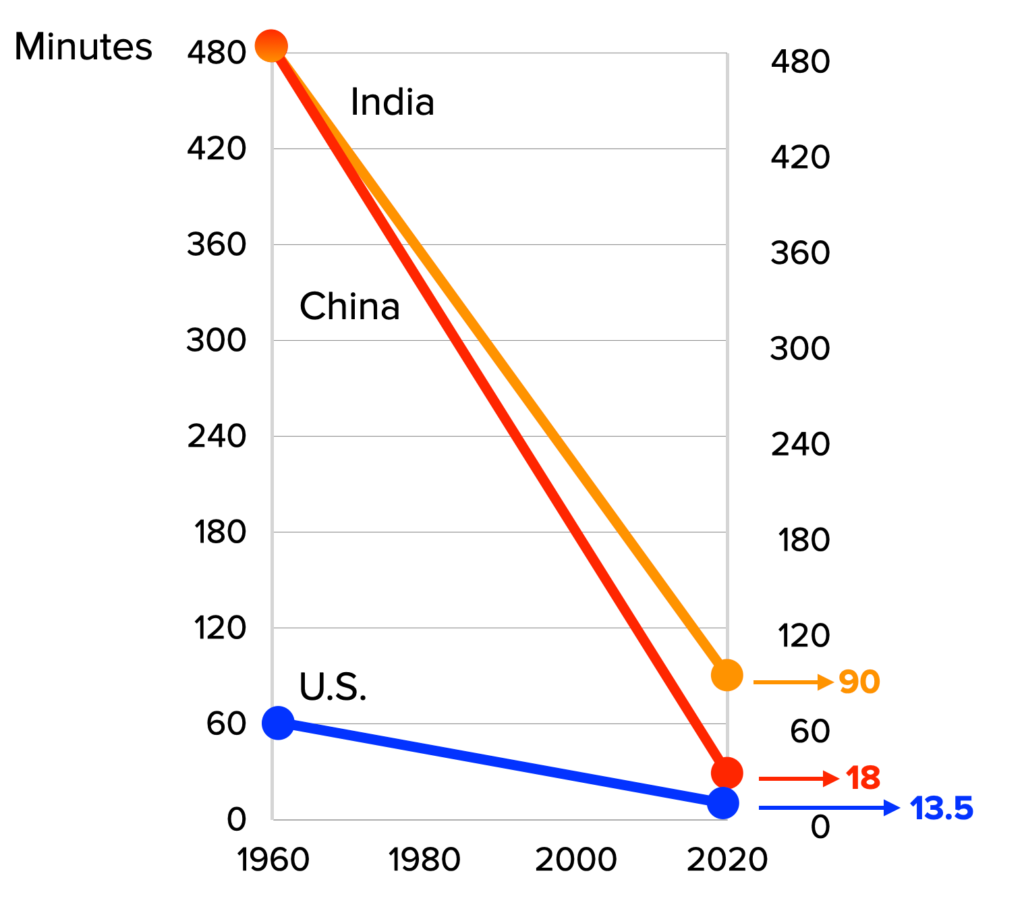
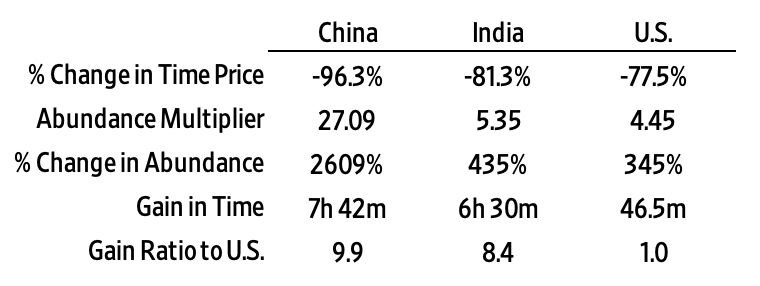
Comparing the cost of this three-food index to GDP per capita in China over this period indicates a 96.3 percent decrease in the time price. Put differently, if the Chinese needed to work eight hours to earn the money to buy their food in 1960, they only needed to work around 18 minutes in 2021. For the time it took to buy one unit in the three-commodity basket in 1960, they would get 27 units in 2021. The Chinese gained 7 hours and 42 minutes a day to devote to other activities.
The time price of a three-commodity basket fell by 81.3 percent in India. Indians who might have needed to work eight hours to buy their food in 1960, needed to work only around 90 minutes to do the same in 2021. For the time it took them to buy one unit in the three-commodity basket in 1960, they got 5.35 baskets in 2021. Thus, they gained 6 hours and 30 minutes a day.
In contrast, using the three-commodity basket as an index, people in the United States, who may have had to work an hour a day to earn enough money to buy their food in 1960, only needed to work around 13.5 minutes to do the same in 2021. The time price of the three-commodity basket fell by 77.5 percent. For the time it took them to earn enough money to buy one unit in the three-commodity basket in 1960, they got 4.45 baskets in 2021. Americans gained 46.5 minutes a day to devote to other activities.
From this perspective, the difference (or time gap) amounted to 420 minutes between Chinese and Indians on the one hand and Americans on the other hand in 1960. By 2021, the time gap dropped to 76.5 minutes for Indians and 4.5 minutes for Chinese. For every minute Americans gained, Chinese gained almost 10 and Indians gained 8.4. Time inequality has dramatically declined.
As new knowledge and innovation decreases the time price of basic food items, people have much more time to devote to other activities, including leisure and learning. And when people have the time to get on learning curves and discover new knowledge, we all benefit.
You can learn more about these economic facts and ideas in our new book, Superabundance, which is available at Amazon.